Security Metric of the Week #81: number of different information security controls
We're not entirely sure why anyone would feel the need to count their security controls, unless perhaps they think there might either be too many or too few, begging the question "How many controls should we have?". Nevertheless, somebody proposed this as an information security metric and ACME's managers explored, discussed and scored it through the PRAGMATIC process:
P
|
R
|
A
|
G
|
M
|
A
|
T
|
I
|
C
|
Score
|
71
|
75
|
72
|
75
|
88
|
30
|
50
|
65
|
43
|
63%
|
They felt that counting security controls would be tedious, error-prone and laborious hence the metric's depressed ratings for Timeliness, Accuracy and Cost-effectiveness. The 88% rating for Meaningfulness suggests that they believed this metric would provide useful information, provided the following issues were addressed.
The word "different" in the full title of the metric could be misleading: different in what sense? Does it actually mean separate as in counting antivirus installations on each IT system as different controls, or does it indicate different kinds or types of control? If so, how different do they need to be to count separately? Failing to define the metric would probably lead to inconsistencies, particularly if various people were involved in counting controls.
ACME would also need to be careful about what does or doesn't constitute an 'information security control'. For instance the door locks on an office, a media storeroom, a toilet and a janitors' closet have quite different implications in relation to protecting ACME's information assets: do any of them qualify as 'information security controls'? Do they all count?
That said, the metric could prove a useful way to manage the overall suite of security controls if the issues were bottomed-out. 'Getting a handle on things' through metrics means not just measuring stuff, but using the numbers both as a means to determine what adjustments to make and to determine that the adjustments do in fact lead to the anticipated changes in the numbers, thus supporting the implied cause-effect linkages.
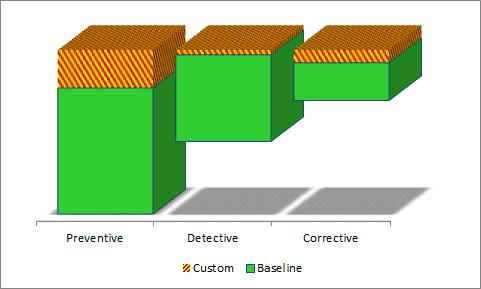
The graph above illustrates a more sophisticated version of the metric that distinguishes preventive, detective and corrective controls, showing baseline and custom control counts for each type. This is just one of many ways the numbers might potentially be counted, analyzed and presented. If you are thinking seriously about this metric, you might also like to consider variants that distinguish:
- Confidentiality, integrity and availability controls;
- Free, cheap, mid-price and expensive controls;
- Controls that have been fully, partially or not yet implemented (established, new or proposed controls);
- Basic, intermediate and advanced controls;
- Old fashioned/traditional and novel/cutting-edge controls;
- Control counts within different departments, operating units, countries, businesses etc.;
- Fail-safe/fail-closed versus fail-unsafe/fail-open controls;
- Automated, manual and physical controls;
- Controls required for compliance with externally-imposed obligations versus those required for internal business reasons;
- Counts versus proportions or percentages;
- Trends or timelines versus snapshots;
- Other parameters (what do you have in mind? What matters most to your organization?).


No comments:
Post a Comment
Have your say!