25 November 2013

SMotW #81: control count

Security Metric of the Week #81: number of different information security controls


We're not entirely sure why anyone would feel the need to count their security controls, unless perhaps they think there might either be too many or too few, begging the question "How many controls should we have?". Nevertheless, somebody proposed this as an information security metric and ACME's managers explored, discussed and scored it through the PRAGMATIC process:

P
R
A
G
M
A
T
I
C
Score
71
75
72
75
88
30
50
65
43
63%

They felt that counting security controls would be tedious, error-prone and laborious hence the metric's depressed ratings for Timeliness, Accuracy and Cost-effectiveness. The 88% rating for Meaningfulness suggests that they believed this metric would provide useful information, provided the following issues were addressed.

The word "different" in the full title of the metric could be misleading: different in what sense? Does it actually mean separate as in counting antivirus installations on each IT system as different controls, or does it indicate different kinds or types of control?  If so, how different do they need to be to count separately? Failing to define the metric would probably lead to inconsistencies, particularly if various people were involved in counting controls. 

ACME would also need to be careful about what does or doesn't constitute an 'information security control'. For instance the door locks on an office, a media storeroom, a toilet and a janitors' closet have quite different implications in relation to protecting ACME's information assets: do any of them qualify as 'information security controls'?  Do they all count?

That said, the metric could prove a useful way to manage the overall suite of security controls if the issues were bottomed-out. 'Getting a handle on things' through metrics means not just measuring stuff, but using the numbers both as a means to determine what adjustments to make and to determine that the adjustments do in fact lead to the anticipated changes in the numbers, thus supporting the implied cause-effect linkages.

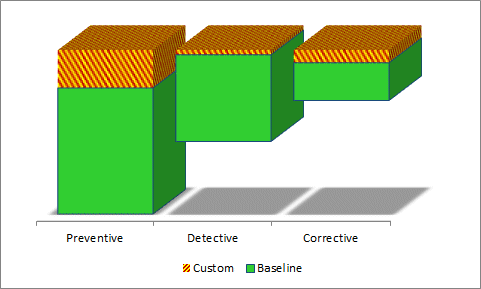
The graph above illustrates a more sophisticated version of the metric that distinguishes preventive, detective and corrective controls, showing baseline and custom control counts for each type. This is just one of many ways the numbers might potentially be counted, analyzed and presented. If you are thinking seriously about this metric, you might also like to consider variants that distinguish:
  • Confidentiality, integrity and availability controls;
  • Free, cheap, mid-price and expensive controls;
  • Controls that have been fully, partially or not yet implemented (established, new or proposed controls);
  • Basic, intermediate and advanced controls;
  • Old fashioned/traditional and novel/cutting-edge controls;
  • Control counts within different departments, operating units, countries, businesses etc.;
  • Fail-safe/fail-closed versus fail-unsafe/fail-open controls; 
  • Automated, manual and physical controls;
  • Controls required for compliance with externally-imposed obligations versus those required for internal business reasons;
  • Counts versus proportions or percentages;
  • Trends or timelines versus snapshots;
  • Other parameters (what do you have in mind?  What matters most to your organization?).


22 November 2013

Roughly right trumps precisely wrong


Inspired by a rant against information overload, I looked up Sturgeon's Law which might be paraphrased as "90% of everything is crap".  That in turn got me thinking about the Pareto principle (a.k.a. the 80/20 rule: 80% of the effects relate to 20% of the causes). The numbers in both statements are arbitrary and indicative, not literal. The 80% or 90% values are meant to convey "a large proportion" and bear no special significance beyond that. Adding the phrase "of the order of" would not materially affect either statement.  

I'm also reminded that (according to Stephen Wright) "42.7% of statistics are made up on the spot", while Benjamin Disraeli's "lies, damned lies, and statistics" reminds us that numbers can be used to mislead as much as to inform.

So how does this relate to PRAGMATIC security metrics?

It is especially pertinent to the Accuracy and Meaningfulness criteria.

Most metrics can be made more Accurate by taking a greater number of measurements and/or being more careful and precise in the measurement process. The number of readings is statistically relevant when we are sampling from a population: the more samples we take, the more accurately we can estimate the total population. Measurement precision depends on factors such as the quality of the measuring instruments and the care we take to determine and record each value. Taking repeated measurements on the same sample is another way to increase the Accuracy. However, that extra Accuracy comes at a Cost in terms of the time, effort and resources consumed.

Greater Accuracy may increase the validity and precision of the metric, but is that valuable or necessary?

Regarding Meaningfulness, the fact that we have special terms for them implies that, despite their imprecision, rules of thumb are valuable. Rough approximations give us a useful starting point, a default frame of reference and a set of assumptions that are in the right ballpark and close enough for government work.

A long long time ago, I dimly recall being taught arithmetic at school, back in those cold dark days before electronic calculators and computers came to dominate our lives, when digital calculations meant using all ten fingers. We learnt our 'times tables' by rote. We were shown how to do addition, subtraction and division with pencil and paper (yes, remember those?!). We looked up logarithms and sines in printed tables. When calculators came along, difficult calculations became even easier and quicker, but so too did simple errors, hence we were taught to estimate the correct answer before calculating it, using that to spot gross errors. It's a skill I still use to this day, because being 'roughly right' often trumps being 'precisely wrong'. To put that another way, there are risks associated with unnecessary precision. At best, being highly accurate is often - though not always - a waste of time and effort. Paradoxically, a conscious decision to use the rounding function or reduce the number of significant figures displayed in a column of numbers can increase the utility and value of a spreadsheet by reducing unnecessary distractions. Implicitly knowing roughly how much change to expect when buying a newspaper with a $20 note has literally saved me money.

The broader point concerns information in general, not just numbers or security metrics of course. A brief executive summary of an article gives us just enough of a clue to decide whether to invest our valuable time in reading the entire thing. A precis or extract is meant to portray the flavor of the piece, not condense its entirety. 

So, to sum up this ramble, don't dismiss imprecise, inaccurate, rough measures out of hand. As the name suggests, "indicators" are there to indicate things, not to define them to the Nth degree. A metric that delivers a rough-and-ready indication of the organization's security status, for instance, that is cheap and easy enough to be updated every month or so, is probably more use to management than the annual IT audit that sucks in resources like a black hole, and reports things that are history by the time they appear in the oh so nicely bound audit report.

19 November 2013

On being cast adrift in a sea of metrics

With a spot of brainstorming and Googling around, it's not hard at all to come up with hundreds of candidate security metrics, often in fact entire families of potential metrics based on any starting point such as the 150 metrics in our book (we'll show you how that works with our next 'example metric of the week', here on the blog). There are loads of information-security-related things that could be measured, and loads of ways to measure them. This is a point we discussed in chapter 3, describing many potential sources of metrics inspiration. 


If you don't perceive a vast ocean
of possible security metrics before you,
you're either lacking in experience
or you need to look harder!

Having come up with a big bunch of possible security metrics, the PRAGMATIC method is a great way to filter out the few that are actually worth putting into production. Metrics with relatively low PRAGMATIC scores naturally gravitate to the bottom of your list while the high-achievers gently rise to the top. Instead of feeling overwhelmed with a confusing mass of possibilities, your job is simply to cream off the floaters, perhaps revisiting a few more that show promise but don't quite make the grade.

Aside from quietly contemplating your shortlist, metrics workshops* work well in many organizations, bringing the people who will generate and use the metrics together to consider and discuss their objectives, requirements and constraints, and to pore over a set of candidate metrics. Another suggestion is to run trials or pilot studies, trying out a few metrics and comparing them side-by-side for a few months to discover which ones work best in practice. Don't forget to ask your audiences what they make of the metrics, which ones they prefer, and why. 

The GQM (Goal -> Question -> Metric) approach is yet another way to figure out what to measure. GQM doesn't necessarily lead to particular metrics, but it emphasizes the business needs and priorities first, using those to focus attention on particular questions or issues of concern in the management of information security risks. The strategic perspective is well worthwhile, at least in suggesting what kinds of security metrics are needed and why i.e. the areas or aspects that ought to be controlled and hence measured.

Furthermore, the manner in which your metrics are analyzed and presented is another opportunity for creative expression: the graphs and images that illustrate this blog are deliberately bright and arguably a bit weird in order to catch your eye. The more formal corporate reporting situation may be different although we would advise against using monochrome line/bar/pie charts unless you have to, for some reason. Security metrics needn't be as dry, dull and boring as a badly-delivered statistics lecture. Try a splash of color at the very least. Let your passion for the subject shine through.  You never know, it might just rub off on the audience ...

Kind regards,
Gary Hinson

If you'd like me or Krag to lead your metrics workshop, do drop us a line. Actually using the PRAGMATIC method for real is an obvious next step once you have read the book. As well as sharing our passion, knowledge and experience in this field with you and your management, we'd welcome the chance to bring you quickly up to speed on PRAGMATIC as well as helping you address your security metrics issues.

18 November 2013

SMotW #80: quality of system security

Security Metric of the Week #80: Quality of system security revealed by testing


Our 80th Security Metric of the Week concerns [IT] system security testing, implying that system security is in some way measured by the testing process.  

The final test pass/fail could be used as a crude binary metric. It may have some value as a measure across the entire portfolio of systems tested by a large organization in a period of a few months, but despite being so simple, underneath lurks a raft of potential issues. If, for instance, management starts pressuring the business units or departments whose software most often fails security testing to 'pull their socks up', an obvious but counterproductive response would be to lower the security criteria or reduce the amount or depth of security testing.  

The number of security issues identified by testing would also be a simple metric to gather but again not easy to interpret. If the metric is tracking upwards (as seen on the demo graph above), is that good or bad? It's bad news if it means that there are more security issues to be found, but good if testing is finding more of the security issues that were there all along. Taken in isolation, the metric does not distinguish these, or indeed other possibilities (such as changes in the way the measurements are made - a concern with every metric unless there is strong change management).

Rather than the simple count, more sophisticated metrics could be designed, perhaps analyzing identified issues by their severity (which is really another way of saying risk) and/or nature (e.g. do they chiefly affect confidentiality, integrity or availability?). ACME managers were quite keen on such a metric, judging by the PRAGMATIC score:

P
R
A
G
M
A
T
I
C
Score
83
88
83
73
90
68
80
82
10
73%

The metric would have been a no-brainer if it were not for the 10% rating on Cost-effectiveness. In the managers' opinion, the metric would need to measure and take account of a number of factors relating to system security, making it fairly expensive. However, with a bit more work up-front, some or all of the data collection processes might perhaps be automated in order to reduce the costs. This, then, is an obvious avenue to explore in developing the metric.  

A pilot study would be a good way to take this forward, trialing the metric and perhaps comparing a number of variants side-by-side, systematically eliminating the weakest over several months until there were just one or two remaining, or until management decided that the metric does not make the grade after all.

08 November 2013

SMotW #79: Employee turn vs account churn

Security Metric of the Week #79: Employee turn versus account churn


This week's metric is typical of the kind of thing that often crops up in security metrics workshops and meetings. Whenever someone invents or discovers a metric like this, they are often enthusiastic about it, and that enthusiasm can be infectious. 

The alliteration in 'employee turn versus account churn' is eye-catching: for some reason buried deep in the human psyche, we find the phrase itself strangely attractive, hence the metric is curiously intriguing. 

We've fallen into a classic trap: the metric sounds 'clever' whereas, in reality, this is a triumph of form over substance. It is far from clear from the cute phrase what the metric is actually measuring, how, why, and for whom. What are 'employee turn' and 'account churn', exactly, and why would we want to compare them? What would that tell us about information security anyway?

In practice, someone at the workshop would probably have asked questions along those lines of the person who proposed the metric, and in turn they would have made a genuine attempt to explain it. In a field as complex as this, it's really not hard for an enthusiastic and influential person to concoct an argument justifying almost any security metric.  Combine that with a team exhausted by discussing dozens of metrics candidates, and it's easy to see why rogue metrics might slip through to the next stage of the process: management review.

By forcing this metric through the PRAGMATIC sausage machine, ACME's managers stripped back the gloss to consider its potential as a means of measuring information security:

P
R
A
G
M
A
T
I
C
Score
30
30
11
36
44
36
62
57
20
36%

Strangely, despite marking the metric down on Predictiveness, Relevance, Actionability, Accuracy, and Cost-effectiveness, they thought it had some Meaning. Perhaps they too were intrigued by the alliterative phrase! Nevertheless, the metric's poor overall score sealed its fate since there were many stronger candidate metrics on the table.

Remember this example whenever someone proposes a 'clever' security metric. Is it truly insightful, or is it simply obtuse and perplexing? By the same token, think twice about your own pet security metrics - and yes, we all have them (ourselves included!). 

Taken in the proper sequence, the Goal-Question-Metric approach forces us to start by figuring out what concerns us and then pose the obvious questions before finally considering possible metrics. Rogue metrics are less likely to crop up and harder to explain and justify. PRAGMATIC filters out any that make it through the earlier screening, despite their being pushed by influential people who are infatuated with their pets. This may seem rather cold and sterile, but think about it: metrics are all about bringing cool rationality, precision and facts to the management of complex processes. There's no room for rogues.

03 November 2013

PRAGMATIC Security Metric of the Quarter #6


The league table for another 3-month's information security metrics shows a very close race for the top slot:


Metric P R A G M A T I C Score

81 69 89 92 80 99 98 90 98 88%

95 97 70 78 91 89 90 85 90 87%

75 75 90 73 84 76 80 77 93 80%

65 76 91 73 83 77 70 61 78 75%

80 85 40 66 72 75 80 80 80 73%

88 86 88 65 78 60 26 90 70 72%

72 80 10 80 80 80 61 80 79 69%

86 80 51 40 65 39 55 95 60 63%

80 70 72 30 75 50 50 65 65 62%

58 55 82 73 86 47 64 66 17 61%

75 70 66 61 80 50 35 36 50 58%

85 85 67 40 77 40 48 16 40 55%
Psychometrics 40 24 0 79 15 55 10 42 5 30%

[Click any metric to visit the original blog piece that explained the rationale for ACME's scoring.]

Hopefully by now you are starting to make out themes or patterns in the metrics that score highly on the PRAGMATIC scale.

Having so far discussed and scored more than half of the example metrics from the book, plus a bunch more metrics from other sources, there's a fair chance we have covered some of the security metrics that your organization currently uses. How did they do? Do the PRAGMATIC scores and the discussion broadly reflect your experience with those metrics?  

We would be amazed if your metrics rate exactly the same as ACME's but if any of your scores are markedly higher or lower, that itself is interesting (and we'd love to hear why - feel free to comment on the blog or email us directly). The most likely explanation is that you are interpreting and using the metric in a way that suits your organization's particular information security management needs, whereas ACME's situation is different. Alternatively, it could be that you are applying the PRAGMATIC criteria differently to ACME (and us!). To be honest, it doesn't matter much either way: arguably the most important benefit of PRAGMATIC is that is prompts a structured analysis, and hopefully a rational and fruitful discussion of the pros and cons of various security metrics.