23 February 2015

Management awareness paper on contingency metrics

Here's the next security awareness paper in the series, describing metrics relating to contingency and business continuity management.

"Measuring the effectiveness of contingency arrangements is a tough challenge, not least because (like insurance policies) we hope we will never need to use them. However it makes sense to measure our investment in contingency plans and preparations, and to confirm whether management is sufficiently confident in them, prior to enacting them as by that stage it will be too late."

Possible contingency metrics suggested in the paper include:

  • RTO and RPO - classic disaster recovery metrics in their own right
  • Resilience - measured by incidents
  • Recovery - proportions of systems for which RTP/RPO are defined, tested and met
  • Costs - easier to measure than benefits, and yet an uncommon metric in practice
  • Management confidence - to what extent do managers believe in the congtingency arrangements?
There are many other possible metrics in this area.  What do you measure? Why?  What do your contingency or business continuity metrics tell you?  

11 February 2015

The art of security metrics

A security metrics opinion piece by Elden Nelson in CSO Online identifies and expands on the following four issues:
  1. "Communications problems are due to a tool-centric rather than risk-centric view of security."While I accept that tool-centrism is not good, I disagree with the casual but simplistic implications that 'a tool-centric view of security' is the cause of communications problems, or that a 'risk-centric view of security' is necessarily the alternative. It sems to me there are many problems in communicating security metrics. The security or security reporting tools per se are less of an issue, in my opinion, than factors such as many technologists' fundamental misunderstandings about their own roles in the organization, about business management, strategy, risk and statistics, plus their apalling communications skills. Furthermore, communications problems are surmountable: given enough time and effort, we can get better at communicating things, putting our points across, but what is it that are we trying to communicate? That, to me, is a much more significant issue with metrics. Turning the focus of metrics from tools to risks is an improvement, but is that sufficient? I don't think it goes far enough: risks don't matter so much as risks to, and opportunities for, the organization and achievement of its business objectives. Relevance is an issue.
  2. "The volume of security products in the market make seamless metrics and reporting very difficult."
    Following closely on the heels of the previous one, this issue is a red herring. Managers don't care about 'security products'. For the most part, they don't even merit a second thought, except perhaps when someone comes cap-in-hand for yet another sizeable investment in some perplexing security technology with the strong likelihood of their being nothing concrete to show for it (an inherent problem with security improvements and risk reductions). Technologists are obsessive about their tech tools, whereas managers are obsessive about the business, things such as targets and objectives, risks and opportunities, efficiencies and budgets, effectiveness and outcomes, compliance obligations, and most of all getting the most out of people, organizations and situations. The tools we use along the way are, for the most part, just the means to an end, not ends in themselves. It's not the computer screen, telephone or paper that matters but the information it conveys.
  3. "Aggregate security products for seamless metrics and better communication."
    What is it with 'seamlessness'? I literally don't understand why anyone would consider the 'absense of seams' relevant to metrics, nor why aggregating products is even mentioned, while the author makes no attempt to enlighten us. The third issue falls headlong into the trap we were warned about in issue one: information security metrics aren't about security tools or products. The Mona Lisa is not a globally renowned work of art due to the astounding features of Leonardo da Vinci's palette knife.
  4. "Security has moved to the central business functions—it’s no longer just an IT issue."
    Leaving aside the question of whether it was ever 'just an IT issue', IT security is history: today, enlightened professionals think and speak not in terms of IT security or cybersecurity but information security and information risk. The technology part is incidental, a mere commodity for the most part. Data is 'just ones and zeroes' with negligible inherent value, in direct constrast to the meaning, the knowledge, the intangible information content encoded in the numbers. The canvas beneath the Mona Lisa's image is, after all, just canvas. The paint is just paint. The physical representation of a lady sitting in a chair is largely incidental to the artwork.  Remember Magritte's "Ceci n'est pas une pipe"?

Security metrics are more representational than literal. Their purpose includes but extends well beyond the mere communication of facts. PRAGMATIC security metrics encourage their recipients to contemplate the meaning and implications for the business, leading to decisions, attitudinal shifts and (in some cases) changes to behaviours and activities. If you fail to appreciate the difference, and don't make the effort to provide relevant, topical information in a useable, meaningful form, your security metrics are doomed. Don't forget that other business information flowing around the typical corporation is, in effect, competing for the same head-space. Your security metrics need to make an impact - and, no, we're not talking about primary colors and animations, or smacking people in the head, tempting though that may be.

Management awareness paper on office information security metrics


The NoticeBored security awareness module from which we've plucked this management-level discussion paper covered information security issues relevant to the typical office or corporate workplace.

In effect, offices are information factories. Office information security controls are essential to keep the factory, its machine tools, operators and production processes running smoothly, efficiently and profitably, and to protect office-based and accessible information assets (paperwork, computer files, and white-collar workers) from all manner of risks.

Office security concerns include:
  • Intruders - burglars, industrial spies and 'lost' visitors wandering loose about the place
  • Fires, floods and accidents 
  • Various logical/IT security incidents affecting the office network and file system, workstations, email and other applications
  • Procedural issues such as workers' and visitors' failure to comply with office information security policies and procedures.
This short awareness paper outlined just a few office security metrics, without delving into details. At the time it was written (2008), we lacked the means to analyze metrics in much detail since the PRAGMATIC approach had not yet been invented. Looking back on it now, the paper is fairly typical of its day, quite naive in approach, leaving the reader to contemplate and perhaps choose between the metrics suggested.  

10 February 2015

63,000 data points

The 2014 Data Breach Investigations Report (DBIR) by Verizon concerns more than ~63,000 incidents across 95 countries that were investigated by 50 organizations, including Verizon of course.

Fair enough ... but what exactly qualifies as an "incident"?  According to the report:
  • Incident: A security event that compromises the integrity, confidentiality, or availability of an information asset. 
  • Breach: An incident that results in the disclosure or potential exposure of data. 
  • Data disclosure: A breach for which it was confirmed that data was actually disclosed (not just exposed) to an unauthorized party.
Those definitions are useful, although for various reason I suspect that the data are heavily biased towards IT (a.k.a. "cyber") incidents. 

~1,300 of the ~63,000 incidents were classified as breaches - an interesting metric in its own right: ~98% of incidents evidently did not result in the disclosure or potential exposure of data. For the beleaguered Chief Information Security Officer or Information Security Manager, that's a mixed blessing. On the one hand, it appears that the vast majority of incidents are being detected, processed, and presumably stopped in their tracks, without data exposure. Information security controls may have failed to prevent the 63,000 incidents, but it appears they did prevent 98% of them becoming actual breaches. That's cause for celebration, isn't it?

On the other hand, however, the 2% of incidents that actually did disclose or expose data clearly represent far more serious business impacts. Figuring out whether incidents are trivial and stoppable or are likely to become breaches is difficult at the time, hence there is little option but to respond to all incidents by default as if they are serious, resulting perhaps in a blasé attitude. 

Worse still, there is a distinct possibility that significantly more than 2% of the incidents were in fact breaches but were either not recognized or not acknowledged as such. The 2% represent abject failures of information security - hardly something that the CISO or ISM is going to admit! If they are responsible for reporting the associated metrics, these figures are dubious.  [I suspect a substantial proportion of the incidents classified as breaches were so classified because of the involvement of auditors and other independent parties, including customers and other business partners who were directly impacted and 'made a fuss'. I wonder how many purely internal breaches - breaches involving confidential business information/trade secrets as opposed to credit card numbers - were simply hushed-up and don't appear in the breach or data disclosure numbers? We won't find out from the 2014 DBIR, and to be fair we ]

Turning now to figure 16 in the report, I'm fascinated by the patterns here:


Take the second and third categories, for instance. Web App Attacks led to more than a third of breaches, yet represented only 6% of incidents. That tells me we have a serious problem with vulnerabilities in web applications. Conversely, although 18% of incidents were due to insider misuse, they caused only 8% of actual breaches - in other words, less than half of them caused real damage. The other categories in these graphs are equally interesting. Look at "cyber-espionage" for instance: only 1% of incidents caused nearly a quarter of the breaches!  [Contrary to what I said earlier, this seems to indicate that "cyber-espionage" is in fact being reported after all. Further, it points to the difficulties of being a CISO/ISM responsible for responding to and stopping such attacks, even though they are such a tiny fraction of incidents.] 

RSA security metrics

Today I caught up with a panel session on security metrics at the May 2014 RSA conference involving Alan Shimel, Andrew McCullough, Ivana Cojbasic and Jody Brazil.

Alan told us more than once that security metrics are 'more art than science', implying (possibly) that this stuff is difficult and irrational.  

The key questions were:
  • What should we measure?
  • Who should we show it to?
  • How should we show it?
I guess we could add Where, When and Why to complete the set.

Andrew's main point was that metrics must be actionable.  Well, yes, Andrew, actionability is an important characteristic of metrics ... but wait, there's more! At least eight more in fact.

Ivana identified three audiences for security metrics: executives, managers and [security] operations/technicians.  According to Ivana, "trends" are the best metrics to present to the execs and managers, while technicians need detailed technical metrics, apparently.  "Trends" aren't metrics per se, but a basic type or style of metric reporting values over time.  Ivana made some vague suggestions about which trends to report, such as compliance and benchmarking trends for execs and "the top three slides" for management, but she didn't really have the time to elaborate.

Despite everybody agreeing that metrics must support or be aligned with business objectives, nobody on the panel made a convincing effort to explain or expand upon the point.

All in all, it was a typical commercial conference panel session, more talking shop than scientific paper, provoking thought rather than offering answers.

Preventive, detective and corrective expenditure

A mediocre article based presumably on a press release from Deloitte hints at a financial metric concerning not the size of an organization's information security budget per se but its shape, specifically the proportions of the budget allocated to preventive, detective and corrective actions (albeit using Deloitte's versions of those labels).

The journalist and/or his source implies that Australian organizations ought to be emulating North American and British ones by spending a greater proportion of their security budgets on detection and correction. Although that advice runs counter to conventional wisdom, the article doesn't adequately explain the reasoning: one could just as easily argue that the Australians are ahead of the game in focusing more on prevention, hence the rest of the world ought to catch up! 

Anyway, a pie chart is an obvious way to represent proportions. The example below, for instance, uses nested pies to compare the budget breakdowns for two fictional organizations, or two business units within one organization, or even this year's security budget breakdown versus last year's:


According to the figure, 'they' are evidently spending a greater proportion of their security budget on preventive controls than 'we' do. Fair enough, but does that information alone tell us anything useful? Which is the better approach? It's hard to derive any useful insight without more information.

In PRAGMATIC terms, the metric doesn't score particularly well according to the mythical ACME Enterprises CISO who assessed it anyway:

  • Predictiveness: 55%. The expenditure on information security is a reasonable indicator of an organization's security status. The nested pies appear to tell us that, other things being equal, 'we' are more likely to suffer incidents than 'they' are but 'we' are also likely to identify, react and recover from them than 'they' are. Unfortunately, 'other things being equal' is a serious constraint: the comparison may be completely flawed otherwise.  Even if the two organizations are about the same size and in the same industry, one might be spending a fortune on its security while the other might be so tight it squeaks when it walks - and there are many more differences between organizations than that. 
  • Relevance: 60%. We probably shouldn't allow preventive, detective and corrective controls to get seriously out of balance, but it's is far from clear what 'balance' actually means in this context. Detective controls, for instance, tend to be relatively expensive compared to corrective controls, hence spending a markedly greater proportion of the security budget on detection rather than correction might be 'balanced' in fact.
  • Actionability: 35%. The metric doesn't prompt any obvious response from the audience, unless the proportions are seriously skewed (e.g. spending next to nothing on corrective controls would imply a risky strategy: if our preventive or detective controls were to fail in practice, we would probably be in a mess).
  • Genuinness: 50%. Security spending doesn't always fall neatly into one of the three catgories, hence there are arbitrary decisions to be made when allocating dollars to categories. This is a common cost-accounting issue. If , on seeing the pies, management takes the stratgegic decision to 'transfer funding from detective to preventive controls', the person compiling the metric might simply re-allocate expenses to appear compliant with the decision, without making any real changes.
  • Meaninfulness: 35%. The metric is not self-evident and needs to be explained to the audience, which is somewhat challenging! The colorful graph looks simple and striking, but as soon as anyone scratched the surface to figure out what it really means, we would struggle.
  • Accuracy: 20%. The 'other things being equal' thing is a concern here, as well as the cost-allocation issue. Unless the metric is measured independently by a competent and trustworthy person/team following strict guidelines, there is a high probability of errors. The drawback applies both to comparisons between organizations or business units, and to comparisons within the same organization over time.
  • Timeliness: 50%. The metric might be prepared and used as part of the budgetary planning process, but it would take some time to achieve any real accuracy. Alternatively, it could be drawn up more quickly as a rough-and-ready measure, at the cost of lower accuracy.
  • Integrity: 70%. Despite our comments above concerning arbitrary cost-allocation decisions, the figures could potentially be independency assessed or audited to establish whether there is a consistent and rational basis ...
  • Cost-effectiveness: 30%. ... which is just one of many ways that this could easily become an expensive metric, with uncertain business benefits.
  • Overall PRAGMATIC score: 45%.
There are loads more security metrics examples in our book including some financial and strategic metrics that out-score and outclass this one, while there is a vast array of other possibilities that we haven't even analyzed.  In short, this metric is a dud as far as ACME is concerned ... but you may feel otherwise, and that's fine. Your situation and measurement needs are different, hence YMMV (Your Metrics May Vary).  The point of this piece, the blog, the website and the book is not to spoon-feed you a meal of tasty information security metrics but to give you the tools to cook up your own, and prompt you to think about them in a structured, rational way.

Kind regards,
Gary

PS  By the way, did you notice that the article uses the phrasing 'so many cents of every dollar spent' rather than percentages? The numbers are identical of course, but cents-in-the-dollar emphasizes the financial aspect, making the presentation more businesslike - a neat little example of the value of expressing information security in business terms. Shame they picked such a dubious metric though!

05 February 2015

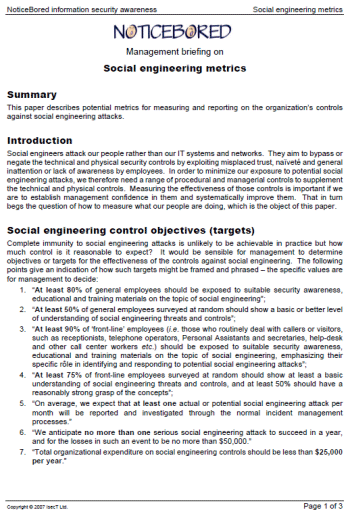
Management awareness paper on social engineering metrics

Security awareness is the primary control against social engineering, hence this is an essential core topic for the awareness program. Making managers aware of how they might measure [the risks and controls relating to] social engineering is the purpose of this awareness paper.

The paper illustrates how elaborating on the control objectives helps to identify relevant security metrics. For example, the objective to 'make the entire workforce aware of social engineering' suggests the need to measure the security awareness program's coverage. 

The paper identifies just three security awareness metrics. There is nothing special about those particular metrics, and they are certainly not the only ways to measure awareness. It is deliberately left as an exercise for the reader to determine firstly whether it might indeed be worth measuring coverage of the awareness program, and if so secondly how best to do that.

By the way, in conjunction with fellow author Walt Williams, I'm currently developing a new information security awareness maturity metric in the same style as the maturity metrics in the book. It should be ready to publish later this month. Watch this space!

Kind regards,
Gary