10 February 2015

RSA security metrics

Today I caught up with a panel session on security metrics at the May 2014 RSA conference involving Alan Shimel, Andrew McCullough, Ivana Cojbasic and Jody Brazil.

Alan told us more than once that security metrics are 'more art than science', implying (possibly) that this stuff is difficult and irrational.  

The key questions were:
  • What should we measure?
  • Who should we show it to?
  • How should we show it?
I guess we could add Where, When and Why to complete the set.

Andrew's main point was that metrics must be actionable.  Well, yes, Andrew, actionability is an important characteristic of metrics ... but wait, there's more! At least eight more in fact.

Ivana identified three audiences for security metrics: executives, managers and [security] operations/technicians.  According to Ivana, "trends" are the best metrics to present to the execs and managers, while technicians need detailed technical metrics, apparently.  "Trends" aren't metrics per se, but a basic type or style of metric reporting values over time.  Ivana made some vague suggestions about which trends to report, such as compliance and benchmarking trends for execs and "the top three slides" for management, but she didn't really have the time to elaborate.

Despite everybody agreeing that metrics must support or be aligned with business objectives, nobody on the panel made a convincing effort to explain or expand upon the point.

All in all, it was a typical commercial conference panel session, more talking shop than scientific paper, provoking thought rather than offering answers.

Preventive, detective and corrective expenditure

A mediocre article based presumably on a press release from Deloitte hints at a financial metric concerning not the size of an organization's information security budget per se but its shape, specifically the proportions of the budget allocated to preventive, detective and corrective actions (albeit using Deloitte's versions of those labels).

The journalist and/or his source implies that Australian organizations ought to be emulating North American and British ones by spending a greater proportion of their security budgets on detection and correction. Although that advice runs counter to conventional wisdom, the article doesn't adequately explain the reasoning: one could just as easily argue that the Australians are ahead of the game in focusing more on prevention, hence the rest of the world ought to catch up! 

Anyway, a pie chart is an obvious way to represent proportions. The example below, for instance, uses nested pies to compare the budget breakdowns for two fictional organizations, or two business units within one organization, or even this year's security budget breakdown versus last year's:


According to the figure, 'they' are evidently spending a greater proportion of their security budget on preventive controls than 'we' do. Fair enough, but does that information alone tell us anything useful? Which is the better approach? It's hard to derive any useful insight without more information.

In PRAGMATIC terms, the metric doesn't score particularly well according to the mythical ACME Enterprises CISO who assessed it anyway:

  • Predictiveness: 55%. The expenditure on information security is a reasonable indicator of an organization's security status. The nested pies appear to tell us that, other things being equal, 'we' are more likely to suffer incidents than 'they' are but 'we' are also likely to identify, react and recover from them than 'they' are. Unfortunately, 'other things being equal' is a serious constraint: the comparison may be completely flawed otherwise.  Even if the two organizations are about the same size and in the same industry, one might be spending a fortune on its security while the other might be so tight it squeaks when it walks - and there are many more differences between organizations than that. 
  • Relevance: 60%. We probably shouldn't allow preventive, detective and corrective controls to get seriously out of balance, but it's is far from clear what 'balance' actually means in this context. Detective controls, for instance, tend to be relatively expensive compared to corrective controls, hence spending a markedly greater proportion of the security budget on detection rather than correction might be 'balanced' in fact.
  • Actionability: 35%. The metric doesn't prompt any obvious response from the audience, unless the proportions are seriously skewed (e.g. spending next to nothing on corrective controls would imply a risky strategy: if our preventive or detective controls were to fail in practice, we would probably be in a mess).
  • Genuinness: 50%. Security spending doesn't always fall neatly into one of the three catgories, hence there are arbitrary decisions to be made when allocating dollars to categories. This is a common cost-accounting issue. If , on seeing the pies, management takes the stratgegic decision to 'transfer funding from detective to preventive controls', the person compiling the metric might simply re-allocate expenses to appear compliant with the decision, without making any real changes.
  • Meaninfulness: 35%. The metric is not self-evident and needs to be explained to the audience, which is somewhat challenging! The colorful graph looks simple and striking, but as soon as anyone scratched the surface to figure out what it really means, we would struggle.
  • Accuracy: 20%. The 'other things being equal' thing is a concern here, as well as the cost-allocation issue. Unless the metric is measured independently by a competent and trustworthy person/team following strict guidelines, there is a high probability of errors. The drawback applies both to comparisons between organizations or business units, and to comparisons within the same organization over time.
  • Timeliness: 50%. The metric might be prepared and used as part of the budgetary planning process, but it would take some time to achieve any real accuracy. Alternatively, it could be drawn up more quickly as a rough-and-ready measure, at the cost of lower accuracy.
  • Integrity: 70%. Despite our comments above concerning arbitrary cost-allocation decisions, the figures could potentially be independency assessed or audited to establish whether there is a consistent and rational basis ...
  • Cost-effectiveness: 30%. ... which is just one of many ways that this could easily become an expensive metric, with uncertain business benefits.
  • Overall PRAGMATIC score: 45%.
There are loads more security metrics examples in our book including some financial and strategic metrics that out-score and outclass this one, while there is a vast array of other possibilities that we haven't even analyzed.  In short, this metric is a dud as far as ACME is concerned ... but you may feel otherwise, and that's fine. Your situation and measurement needs are different, hence YMMV (Your Metrics May Vary).  The point of this piece, the blog, the website and the book is not to spoon-feed you a meal of tasty information security metrics but to give you the tools to cook up your own, and prompt you to think about them in a structured, rational way.

Kind regards,
Gary

PS  By the way, did you notice that the article uses the phrasing 'so many cents of every dollar spent' rather than percentages? The numbers are identical of course, but cents-in-the-dollar emphasizes the financial aspect, making the presentation more businesslike - a neat little example of the value of expressing information security in business terms. Shame they picked such a dubious metric though!

05 February 2015

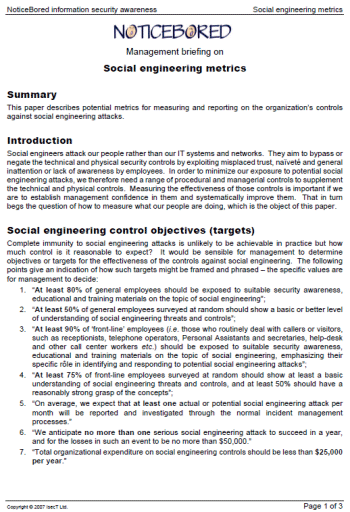
Management awareness paper on social engineering metrics

Security awareness is the primary control against social engineering, hence this is an essential core topic for the awareness program. Making managers aware of how they might measure [the risks and controls relating to] social engineering is the purpose of this awareness paper.

The paper illustrates how elaborating on the control objectives helps to identify relevant security metrics. For example, the objective to 'make the entire workforce aware of social engineering' suggests the need to measure the security awareness program's coverage. 

The paper identifies just three security awareness metrics. There is nothing special about those particular metrics, and they are certainly not the only ways to measure awareness. It is deliberately left as an exercise for the reader to determine firstly whether it might indeed be worth measuring coverage of the awareness program, and if so secondly how best to do that.

By the way, in conjunction with fellow author Walt Williams, I'm currently developing a new information security awareness maturity metric in the same style as the maturity metrics in the book. It should be ready to publish later this month. Watch this space!

Kind regards,
Gary 

16 January 2015

Management awareness paper on security compliance metrics

Compliance with information security related obligations, privacy laws in particular, was already a major issue for management when this paper was written back in 2007. Over the succeeding years, it has grown even bigger and yet we still often hear people discussing compliance in simplistic, black-and-white or binary terms in the sense of "You either comply or you don't". In reality, compliance is usually a matter of interpreting and weighing-up the evidence concerning the extent to which the obligations have or have not been fulfilled, and their relative importance. Compliance may not be glorious Technicolor but there are definitely shades of grey!

This metrics briefing proposed a few simple measures of the extent and speed of compliance, as well as the costs relating to or arising from compliance.  

In addition to legislation, it mentioned compliance with and enforcement of corporate policies and other requirements (such as good security practices and contractual obligations - PCI-DSS being a classic example).  

We developed further and elaborated on the concept of a 'security compliance status' metric that was introduced in this paper in later briefings. Looking at the paper now, with the benefit of hindsight, it seems rather naive but it served a purpose as a security awareness item for managers.

06 January 2015

Management awareness paper on physical security metrics

In the context of information security, physical security is about protecting tangible assets holding, communicating or processing valuable information - primarily ICT systems and data storage media - from physical incidents such as theft, criminal or accidental damage, loss, sabotage, fire, flood, mechanical breakdown, electrical surges, dips and power cuts, static discharge, magnetic or electrical interference etc. that would damage the information content or the services provided.

Strictly speaking, it includes physical protection for people, workers particularly, since we also constitute physical information assets - well most of us anyway (some are liabilities!).  'Health and safety' is, in a sense, part of information security, along with substantial parts of HR.

This very brief metrics discussion paper, written seven years ago, does not explore the entire scope of physical security but mentions just a few considerations around physical security targets and measurements.  It was not one of our best efforts ... and yet it might just prompt you to think of something worth measuring in your situation.

I promise the quality of this series of papers improves as we head into 2015. Our understanding of metrics improved markedly as we did the thinking and research for the PRAGMATIC book, on top of which we revisited, updated and expanded on the older papers as we completed successive cycles of information security topics. Yes, I know it's "jam tomorrow" but stick with us and enjoy the journey. 

30 December 2014

Intranet stats - a neglected security metric

Most organizations of any size have a corporate intranet and I suspect you, dear reader, have an information or IT security website on yours.

Are you tracking the page views?

The count, or rather the trend in the number of page views for the security site can be an interesting, useful, perhaps even PRAGMATIC metric in its own right.

Take this very blog for example. Google kindly tracks and conveniently provides the admins with page view statistics in the form of little blue graphs. Google's default stats view shows the daily page counts for the present month, something like this:

Given the specialist nature of security metrics and our relatively narrow (distinguished, enlightened and very welcome!) readership, the default graph is too peaky, whereas it is a little easier to identify trends from the monthly version:


Pulling further back, the aggregated annual stats follow a pretty clear pattern which we've picked out by eye in red just in case you missed it:
The book had not even been printed when we launched this blog back in 2012. Interest peaked when it was published in January 2013, then declined gently until a few months ago when we are delighted to report that the upward trend resumed quite strongly - a second wave maybe.

Of course in spotting the second wave we might be exhibiting 'confirmation bias', one of many biases noted in the book, and if it mattered we really ought to consult a qualified statistician to analyze the numbers scientifically rather than 'by eye' ... but this is merely an illustration, and 'by eye' is good enough for our purposes. We're plenty patient enough to wait the months it will take to determine whether the apparent upward trend turns out to be genuine or just wishful thinking!

Turning now to your intranet security site, page counts like these are just one of a wide variety of statistics that the intranet webserver almost certainly tracks for you. Most webservers record far more information in their logs, while if you choose to go that route, dedicated tracking and analytical applications (such as Google Analytics for publicly-accessible sites at least) offer a bewildering array of statistics concerning things such as the pages visited, time spent on each page, website assets downloaded, the sequence of pages visited, browser versions, visitor locations and more. True, some of those details can be witheld or faked by the more security-conscious or paranoid visitors, but that's even less likely on an intranet than on the WWW so can be safely ignored in this context.

The big question, as always, is "Which metrics are actually worth the effort?" It costs real money to gather, anlyze, present and consider metrics, so as with any other business activity, they need to earn their keep. Figuring out the answer, as always, involves first understanding the organization's goals or objectives for the intranet site, then elaborating on the questions arising, then identifying potential metrics, and finally down-selecting a few cost-effective metrics using an approach such as PRAGMATIC.

It can be quite interesting and useful to elaborate on the objectives for an intranet site, although we seldom bother, while the questions arising are equally revealing.  One might well ask, for example:
  • What constitutes a successful security intranet site?  How do we define success?  What are we trying to achieve?
  • What proportion of employees visit the site over the course of, say, a year?
  • Which parts of the site are the most or least popular ... and why?
  • Which pages are the most or least "sticky" or engaging ... and why? 
  • How does information security's intranet site stack up against other business departments?
  • Do visits to the site reflect awareness and training initiatives, or incidents, or something else (can we explain the patterns or trends)?
  • Are certain groups or categories of employee more or less likely than others to browse the site? 
  • ... 
... Once you start, it's not hard to come up with a list of objectives, a set of questions and (implicitly at least) a suite of possible metrics. If you find yourself short of inspiration, this is an ideal task for a metrics workshop where participants feed and feed off each other.

Analyzing the possible metrics to identify those you intend to use can also be done in the workshop setting, pragmatically on scratchpads, or more formally using spreadsheets and documents that get circulated for comment. 

Of course, if all of that is too hard, you can probably get what you need, for now, from the page counts ... so track them, and don't forget to check and ponder the stats every so often. It's as a good place to start as any.
Happy new year!
Gary

20 December 2014

Management awareness paper on email security metrics

Measuring the information security aspects of email and indeed other forms of person-to-person messaging implies first of all that you understand what your security arrangements are intended to achieve.  What does it mean to "secure email"?  If that's too hard to answer, turn it on its head: what might be the consequences of failing adequately to secure email? Does that help?

Our next metrics discussion paper opens with a brief analysis of the 'requirements and targets', also known as the objectives, of email security, expressed in broad terms. For instance, preventing or at least reducing the issues relating to or arising from spam and malware is a common objective ... hence one might want to measure spam and email-borne malware, among other aspects. 

That in turn begs questions about which specific parameters to measure and how - for instance, there are many possible ways to measure spam, such as the:
  • Number of spam emails arriving at the organization, or rather the rate of arrival (spams per hour, day, month or whatever);
  • Number of spam emails leaving the organization (!);
  • Types of spams detected, perhaps analyzed according to the differing threats they represent, ranging perhaps from trivial/timewasting to targeted spear-phishing attacks;
  • Proportion of spam that is detected and blocked versus that passed to users (and, hopefully, identified by them as spam);
  • Cost of anti-spam controls, including the anti-spam software and systems, network and system load, user and support time spent on the problem etc.
For each of those potentially interesting concerns, there may be several actual ways to generate the corresponding measures, and several ways to analyze, present and hopefully use the data. The paper outlines just a few examples to illustrate the approach, but it should be obvious from the above that we could easily have written a very long and boring treatise just on email security metrics. We didn't ... because the paper was 'just' written for awareness purposes: it is designed to get managers thinking and talking about security metrics, opening their eyes to the possibilities and encouraging them to consider their own, specific information needs as opposed to the few generic examples given. Rather than boring the pants off our readers, we're hoping to intrigue and stimulate them, catch their imagination not write a book on it.  [By the way, that's one of the objectives for the security awareness program, implying that perhaps we might measure it in order to confirm whether the awareness program is achieving the objective, and if not suggest how we might do better!]

In case you missed it, there's an important point here with implications for all metrics (not just infosec metrics!). What we choose to measure depends on our information needs, organizational circumstances, objectives, challenges, maturity level and so on.  Your situation is different, hence you will probably be better served by a different set of metrics. Much as we would like to offer you a little pre-canned set of email security metrics, chances are they won't work terribly well for you. They'll be sub-optimal, perhaps costly, distracting and generally unhelpful. Remember this when anyone enthuses about particular security metrics, or when someone naively posses the classic "What metrics are best for X?"

One might argue that since we share a number of common information security challenges (such as spam), we might benefit from a number of common metrics ... but that's overly simplistic, just as it would be nuts to suggest that we should all employ identical anti-spam controls. Some email security metrics might well turn out to be more or less common than others but that alone is not a sensible reason to select or avoid them respectively.

This is why we invented the PRAGMATIC approach. While it is easy to come up with long lists of possible metrics using methods such as Goal-Question-Metric (see Lance Hayden's book "IT Security Metrics") and metrics catalogs (e.g. the 'consensus security metrics' from CIS), there was a distinct lack of guidance on how to shortlist and finally choose the few metrics actually worth implementing.